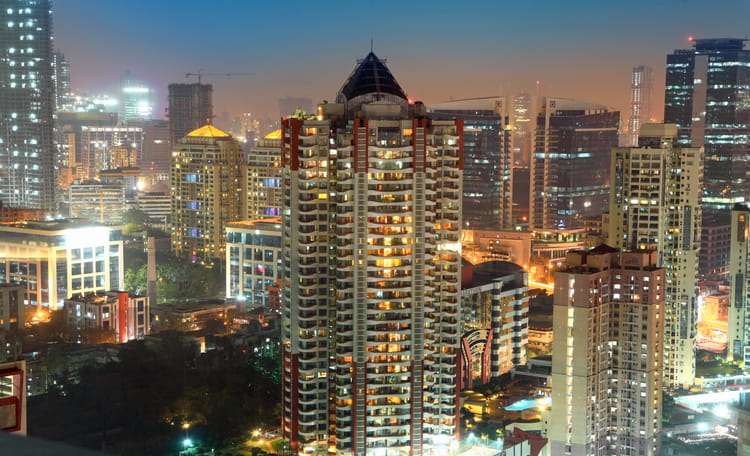
- Khan Market ranks 24th globally, maintaining its position as India’s most expensive main street with rents up 3% year-on-year
- Gurgaon’s Galleria Market leads APAC with 25% rental growth, followed by Connaught Place (+14%) and Kemps Corner (+10%)
- London’s New Bond Street becomes the world’s most expensive retail destination, overtaking Milan’s Via Montenapoleone and New York’s Upper Fifth Avenue
- 58% of tracked retail streets saw rent increases, reflecting demand for space far exceeding availability
Cushman & Wakefield’s 35th edition of its flagship retail report, Main Streets Across the World, reveals that Khan Market in New Delhi ranks 24th globally, maintaining its position as India’s most expensive retail location with rents at USD 223 per square foot per year (psf/yr), up 3% year-on-year. While its global ranking slipped slightly from 23rd to 24th, Khan Market remains India’s most expensive high street, reflecting resilience and enduring appeal amid a competitive global landscape.
London’s New Bond Street, meanwhile, has been crowned the world’s most expensive retail destination for the first time, where rents have risen by 22% in the past year to USD 2,231 per square foot per year (psf/yr). New Bond Street has leapfrogged Milan’s Via Montenapoleone ($2,179 psf/yr), which last year became the first European street to top the global rankings, and New York’s iconic Upper Fifth Avenue ($2,000 psf/yr).
The report focuses on headline rents in best-in-class urban locations across the world, many of which are linked to the luxury sector, utilising Cushman & Wakefield’s proprietary data. The global index ranks the most expensive main street in each market.
Gautam Saraf, Executive Managing Director, Mumbai & New Business, Cushman & Wakefield said,
“India’s high streets are demonstrating exceptional resilience and growing global prominence. Premium destinations like Khan Market, Connaught Place, and Galleria Market are attracting international and domestic brands, driven by rising affluence and evolving consumer preferences. With limited mall supply, these high streets have become strategic hubs for retailers seeking visibility and engagement. Year-to-date, high streets have accounted for over half of retail leasing activity, underscoring their critical role in shaping India’s retail evolution. This transformation reflects a broader trend of premiumisation and experiential retail, positioning India as one of Asia Pacific’s most dynamic markets.”
Notably, India’s retail sector has outperformed both the global and APAC averages, registering a 6% YoY rental growth.
Globally, rents grew on average at 4.2% with 58% of markets experiencing rental growth. The Americas led regional rental growth at 7.9%, driven by currency effects in South America. Europe experienced steady 4% year-on-year (y-o-y) growth, with standout performances in Budapest and London. Meanwhile rents in Asia Pacific slowed to 2.1%, with strong growth in India and Japan offset by economic headwinds in Greater China and Southeast Asia.
Main Streets Across the World – Global Ranking by Market 2025
|
Global Ranking 2025 |
Global Ranking 2024 |
Location |
Rent (USD/sq.ft/yr) |
Rent (EUR/sqm/yr) |
YOY (LCY) |
|
1 |
3 |
New Bond Street, London |
$2,231 |
€20,482 |
22% |
|
2 |
1 |
Via Montenapoleone, Milan |
$2,179 |
€20,000 |
0% |
|
3 |
2 |
Upper Fifth Avenue (49th to 60th Sts), New York |
$2,000 |
€18,359 |
0% |
|
4 |
4 |
Tsim Sha Tsui (main street shops), Hong Kong |
$1,515 |
€13,907 |
-6% |
|
5 |
5 |
Avenue des Champs Élysées, Paris |
$1,364 |
€12,519 |
0% |
|
6 |
6 |
Ginza, Tokyo |
$1,257 |
€11,538 |
10% |
|
7 |
7 |
Bahnhofstrasse, Zurich |
$1,051 |
€9,644 |
0% |
|
8 |
8 |
Pitt Street Mall, Sydney |
$795 |
€7,294 |
4% |
|
9 |
9 |
Myeongdong, Seoul |
$653 |
€5,997 |
1% |
|
10 |
10 |
Kohlmarkt, Vienna |
$601 |
€5,520 |
2% |
Source: Cushman & Wakefield
Asia Pacific Highlights:
Rental growth in Asia Pacific slowed from 2.8% in 2024 to 2.1% in 2025, though performance varied widely across markets. India’s Tier 1 cities led the rental growth in APAC region, with Gurgaon’s Galleria Market recording a 25% increase, followed by Connaught Place in New Delhi (14%) and Kemps Corner in Mumbai (10%). This growth was driven by limited supply and strong demand, underlining the enduring appeal of prime retail locations in India’s key urban hubs and broader trend of premiumisation. Across 16 tracked Indian locations, rental growth averaged 6% year-on-year.
At the other end of the spectrum, APAC’s most affordable main street is also in India- Anna Nagar 2nd Avenue in Chennai, where rents remain at USD 25 psf/yr.
Elsewhere in the region, Japan’s Ginza and Omotesando in Tokyo saw strong growth of 10% and 13% respectively, while rents in Hong Kong’s Tsim Sha Tsui declined by 6% to $1,515 psf/yr. Sydney’s Pitt Street Mall recorded modest growth of 4%, reaching $795 psf/yr, marking a return to positive momentum after years of stagnation.
Cushman & Wakefield’s Asia Pacific Head of Retail Sales & Strategy Sona Aggarwal, said:
“Asia Pacific retail is demonstrating resilience despite economic challenges. India, Korea and Japan are leading growth with strong demand and premiumisation. Confidence is picking up in Singapore and Sydney, with rents inching higher. Vietnam and parts of Greater China remain a little soft due to geo-political and economic headwinds. On balance, shifting shopper habits and highly adaptive retailer strategies driving innovation in “phygital” experiences keep our dynamic region poised for long-term growth.”
Asia Pacific Ranking by Location 2025
|
APAC Ranking 2025 |
APAC Ranking 2024 |
Market |
City |
Location |
Rent (USD/sf/yr) |
Rent (EUR/sqm/yr) |
YOY (LCY) |
|
1 |
1 |
Greater China |
Hong Kong |
Tsim Sha Tsui (main street shops) |
$1,515 |
€13,907 |
-6% |
|
2 |
2 |
Greater China |
Hong Kong |
Causeway Bay (main street shops) |
$1,374 |
€12,610 |
-4% |
|
3 |
3 |
Japan |
Tokyo |
Ginza |
$1,257 |
€11,538 |
10% |
|
4 |
4 |
Japan |
Tokyo |
Ometesando |
$1,028 |
€9,441 |
13% |
|
5 |
5 |
Japan |
Osaka |
Midosuji |
$914 |
€8,392 |
14% |
|
6 |
6 |
Australia |
Sydney |
Pitt Street Mall |
$795 |
€7,294 |
4% |
|
7 |
7 |
Greater China |
Hong Kong |
Central (main street shops) |
$726 |
€6,669 |
1% |
|
8 |
8 |
Japan |
Tokyo |
Shinjuku |
$686 |
€6,294 |
0% |
|
9 |
9 |
South Korea |
Seoul |
Myeongdong |
$653 |
€5,997 |
1% |
|
10 |
10 |
South Korea |
Seoul |
Gangnam Station |
$578 |
€5,302 |
4% |
Source: Cushman & Wakefield
About Cushman & Wakefield Cushman & Wakefield (NYSE: CWK) is a leading global commercial real estate services firm for property owners and occupiers with approximately 52,000 employees in nearly 400 offices and 60 countries. In 2024, the firm reported revenue of $9.4 billion across its core service lines of Services, Leasing, Capital markets, and Valuation and other. Built around the belief that Better never settles, the firm receives numerous industry and business accolades for its award-winning culture. For additional information, visit www.cushmanwakefield.com.