CONTACT US
Share: Share on Facebook Share on Twitter Share on LinkedIn I recommend visiting cushmanwakefield.com to read:%0A%0A {0} %0A%0A {1}
MOBILE_marketbeat-digital-assets_Walnut Creek_east bay office.jpg LG-HERO_marketbeat-digital-assets_Walnut Creek_east bay office.jpg

Insights

East Bay Walnut Creek Office MarketBeat

This MarketBeat report covers the East Bay Walnut Creek office market for Q3 2026, highlighting key themes shaping local conditions. Read the report for the full narrative and details.

DOWNLOAD THE Q3 2026 REPORT

Economy: Unsteady

The East Bay, consisting of Alameda and Contra Costa counties, recorded a gain of 3,000 jobs year-over-year (YOY), lowering the unemployment rate by 40 basis points (bps) to 4.4%. Throughout the East Bay, healthcare has been a driving force behind employment growth in the past year, but despite overall gains, the broader technology industry, previously a driver of occupancy growth, has faced softness and continues to weigh on office leasing. While nearby San Francisco has experienced an influx of leasing activity from AI companies, or those servicing them, that demand has yet to spill over to the East Bay office market in a meaningful way.

Supply and Demand: Leasing Rebound

The East Bay Walnut Creek office market closed the third quarter with a vacancy rate of 30.3%, down 20 bps from the prior quarter but still up 140 bps YOY. This drop in vacancy comes as the result of 40,651 square feet (sf) of net absorption. The market has now recorded occupancy gains for the past two quarters, following 12 consecutive quarters of negative net absorption dating back to the second quarter of 2023. Class A space, which for many quarters had been the leader in occupancy loss, was responsible for the majority of the positive absorption this quarter at 36,781 sf. Walnut Creek Pleasant Hill BART led all submarkets with a 62,275-sf gain in occupancy, while Walnut Creek Downtown faced the greatest loss with 26,955 sf of negative absorption as several new small spaces hit the market. The average time on market for office space continued to rise across all submarkets in the third quarter, to a marketwide average of 42.5 months as commodity space struggles with a lack of demand. While the region has made some gains in occupancy, it has become apparent that certain product may continue to wait for a broader surge in demand. Total leasing activity reached 272,997 sf, the highest level in over a year. Of this, 93% of leasing volume came from Class A office, including the 11 largest leases of the quarter. Over half of these leases were direct new deals, signifying sustained demand for the best office properties in the market. The largest lease of the quarter, and the year, was a renewal of 96,944 sf by AssetMark at 1655 Grant Street in Concord. Elsewhere in Concord, Regional Center of the East Bay renewed its lease of 40,027 sf and expanded into an additional 20,170 sf, for a total of 60,197 sf at 1320 Willow Pass Road. Concord led the region in leasing this quarter, largely thanks to these two deals, with 176,356 sf.

Pricing: Stable

The overall asking rate in the East Bay Walnut Creek closed the third quarter at $3.06 per square foot (psf) on a monthly full-service basis, level with the prior quarter and YOY. Rental rates reached their lowest point since 2019 in the third quarter of 2025, and have remained there since, aside from a $0.01 bump to $3.07 psf in the first quarter of this year. For the second consecutive quarter, Class A rates fell slightly while Class B rates rose by the same margin, sitting at $3.15 psf and $2.74 psf, respectively. Walnut Creek Pleasant Hill BART and Walnut Creek BART tied for the highest overall asking rate at $3.69 psf. Walnut Creek Downtown maintained the highest Class A asking rates in the region by a wide margin, at $5.35 psf. As tenants continue to place value on high-quality, well-located office space, Class A asking rates in specific submarkets could continue to rise despite the elevated vacancy. Walnut Creek Downtown Class A has seen a modest increase in vacancy YOY, yet at the same time rates have risen by $0.12 psf. Over the same period Walnut Creek BART Class A vacancy rose 160 bps, and rates went up by $0.15 psf. Walnut Creek Shadelands, with its older, less location-oriented inventory, remains the submarket with the lowest overall asking rate at $2.41 psf.

Sales: Activity Continues

The first half of the year saw several large sales and the third quarter followed suit with another major transaction. Synergy Petroleum Enterprises, Inc. purchased 1600 Riviera Avenue, a 128,090-sf Class A office property located in the Walnut Creek BART Area, from Eagle Canyon Capital. The buyer paid $14.5 million, or $113 psf, and plans to reposition and lease the property. In Walnut Creek Downtown, Cilker purchased the 21,200-sf 2099 Mount Diablo Boulevard for $7.7 million, or $362 psf, a strong price for a well-located, fully leased office building. As the leasing market is showing signs of heating up, there may be increased investor interest in the region through the end of 2026 and beyond.

Insights in your Inbox
Subscribe to the latest local market research, insights and analysis from Cushman & Wakefield across the United States.
Subscribe

Current Marketbeats

marketbeat_san francisco_life-sciences_web-card.jpg
MarketBeat

Bay Area Life Sciences MarketBeat

This MarketBeat report covers the SF Bay Area life sciences real estate market for Q2 2026, highlighting key themes across the economy, supply and demand, pricing, and tenant activity. Read the report for the full details and context.
Jason Karbelk • 8/3/2026
Office MarketBeat Report (image)
Q2 2026 East Bay Walnut Creek Office Report

The East Bay Walnut Creek office market closed the second quarter with a vacancy rate of 30.8%, up 10 bps from the previous quarter and 280 bps YOY, the result of 19,835 square feet (sf) of negative net absorption.

Download Full Report

Office MarketBeat Report (image)
Q2 2026 East Bay Pleasanton Office/R&D Report

East Bay Pleasanton office vacancy in the Tri Valley, consisting of Dublin, San Ramon, Pleasanton and Livermore, closed the second quarter at 21.5%, an 80 bps increase from the previous quarter but down 10 bps YOY.

Download Full Report

Industrial MarketBeat Report (image)
Q2 2026 East Bay Pleasanton Industrial Report

The vacancy rate in the East Bay Pleasanton or Tri-Valley market closed the second quarter at 9.5%, down 170 basis points (bps) from the previous quarter but still up 130 bps YOY.

Download Full Report

Related Insights

Web Card.png
Research • Valuation

Industrial / Logistics Investor Outlook

Examine the U.S. industrial markets, focusing on the macroeconomic and industry-specific factors shaping supply, demand, and investment performance.
Michael J. Schaeffer, MAI, FRICS • 10/13/2026
The Signal web card
Insights

Community Trust in Data Center Development

Ben Mann joins The Signal to discuss why data center projects across the U.S. are running into growing political and community opposition.
10/8/2026
MM Web Card Image 750x456.jpg
Article • Investment / Capital Markets

Market Matters: Exploring Real Estate Investment Conditions & Trends

Explore current conditions, short-term developments and long-term economic trends so you can better understand their impact on the real estate investing environment.
9/29/2026
Central_Industrial Labor GWS_C&W_Q3 2026 Webcard
Research

Central Region Industrial Labor Report

Explore the interplay between the supply and demand for industrial labor in the warehouse and manufacturing sectors, as well as the supply and demand for industrial space.
Gregory Rogalla • 9/22/2026
focg-industrial-2026-web card_page.jpg
Research • Construction

Industrial Construction Cost Guide

Industrial construction costs are reaccelerating across the Americas, reversing the flat-to-lower pricing seen a year earlier. Tariffs and other pressures are filtering through to pricing.  
Brian Ungles • 9/17/2026
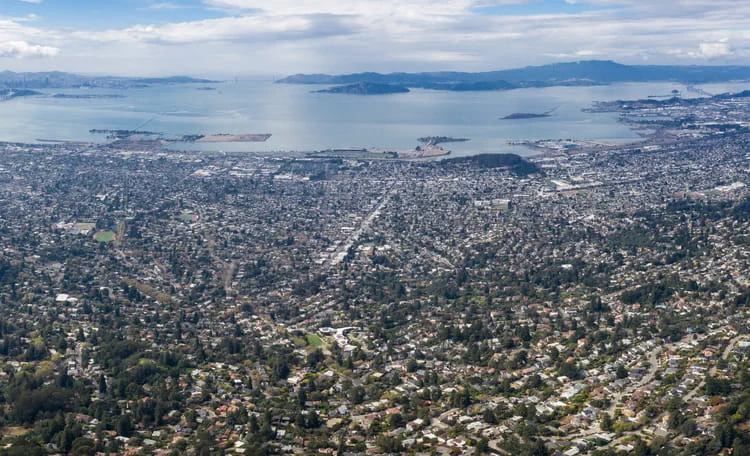
Walnut Creek Pleasanton Area Aerial
MarketBeat

Walnut Creek/Pleasanton

Explore Walnut Creek commercial real estate with MarketBeat reports covering local sector performance and the trends shaping market conditions.
Wescott Owen • 4/27/2026
042024-Chief-Economist-web-card
Research • Economy

Chief Economist's Perspective: U.S. Macro Outlook

Kevin Thorpe discusses how the next few months of economic data will be critical in determining the economic and CRE outlook for the remainder of the year.
Kevin Thorpe • 4/30/2024
energy star certification
Article • Sustainability / ESG

​​The Energy Star Portfolio Manager: Helping Buildings Meet New Performance Standards​

Forget gasoline-fueled, tanked-up automobiles. America’s real energy guzzlers are buildings—both commercial and residential—which account for one-third of all greenhouse gas emissions every year.
Jack Pufunt • 9/20/2023
Midwest-Spec-Report_web-card
Article

Midwest Speculative Construction Report

Speculative construction is by its very definition, a risk. Many developers wonder: if we build it, will tenants come?
David Hoebbel • 12/15/2022
Tech Cities Washington, DC
Article • Technology

Global Tech Cities: Washington, D.C.

With a significant growth forecast for the global tech sector in the next 10 years, the evolution of tech cities around the world as hubs of tech talent and suitable commercial real estate will continue, and Washington, D.C. is no exception. In this article we assess how Washington, D.C. stacks up in the tech space.
Nathan Edwards • 9/2/2022
Global Cloud Report Card Image
Research • Technology

State of the Cloud: Data Center Global Cloud Report

The recent pandemic has accelerated the move of companies large and small to the major cloud services. They are drawn by the scalability and accessibility of these platforms that are in place to assist with the complexities of a fully distributed workforce.  
Andrew Fray • 8/27/2020
Lease Audits Article
Article

DALLAS - Lease Audits

In the world of commercial real estate, lease audits can be an important tool for brokers to ensure their clients get a fair deal as related to operating expenses.
1/13/2020

CAN'T FIND WHAT YOU'RE LOOKING FOR?

Get in touch with one of our professionals.

With your permission we and our partners would like to use cookies in order to access and record information and process personal data, such as unique identifiers and standard information sent by a device to ensure our website performs as expected, to develop and improve our products, and for advertising and insight purposes.

Alternatively click on More Options and select your preferences before providing or refusing consent. Some processing of your personal data may not require your consent, but you have a right to object to such processing.

You can change your preferences at any time by returning to this site or clicking on  Cookies

More Options
Agree and Close
These cookies ensure that our website performs as expected,for example website traffic load is balanced across our servers to prevent our website from crashing during particularly high usage.
These cookies allow our website to remember choices you make (such as your user name, language or the region you are in) and provide enhanced features. These cookies do not gather any information about you that could be used for advertising or remember where you have been on the internet.
These cookies allow us to work with our marketing partners to understand which ads or links you have clicked on before arriving on our website or to help us make our advertising more relevant to you.
Agree All
Reject All
SAVE SETTINGS